PARTNER NETWORK
Tiger Woods Foundation
North America
$13,588,753
$11,830,471
87.00%
9.02 Years
Mission
Use Placeholder Paragraph
Financial Summary
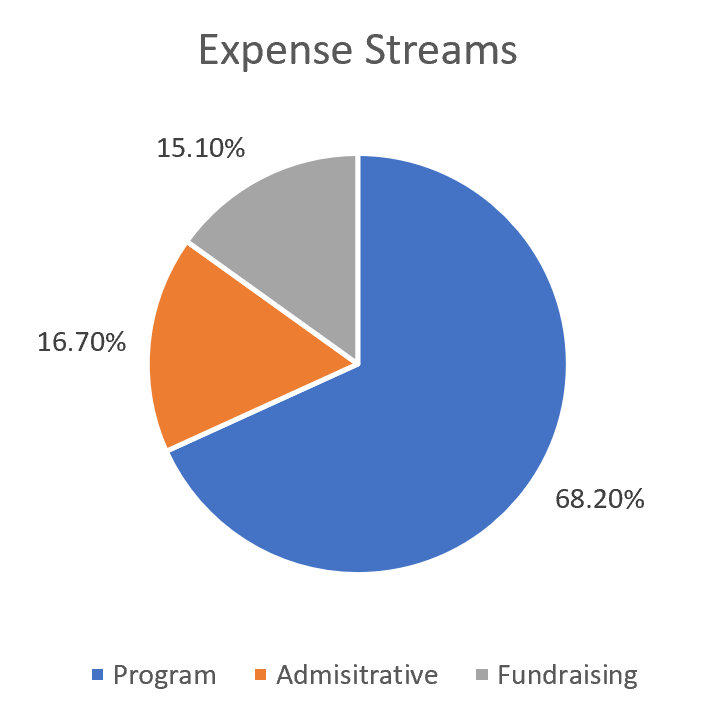
Program Expenses:
$69.1% ($9,390,848)
Total Expenses:
87.1% ($11,830,471)
Fundraising Efficiency:
0.13
Working Capital:
9.02 Years
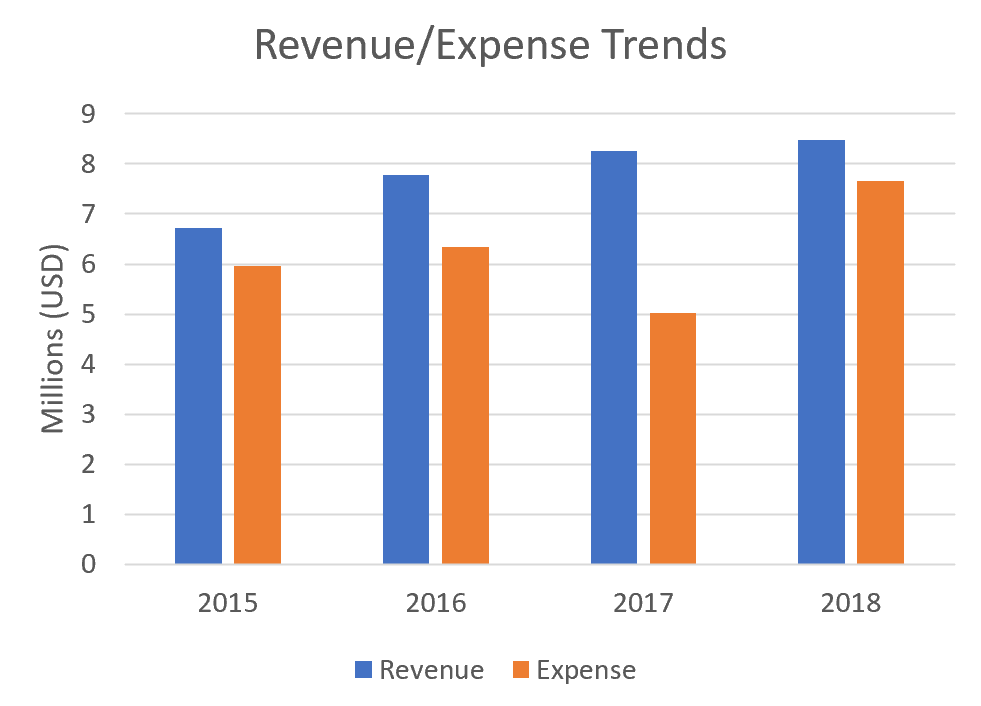
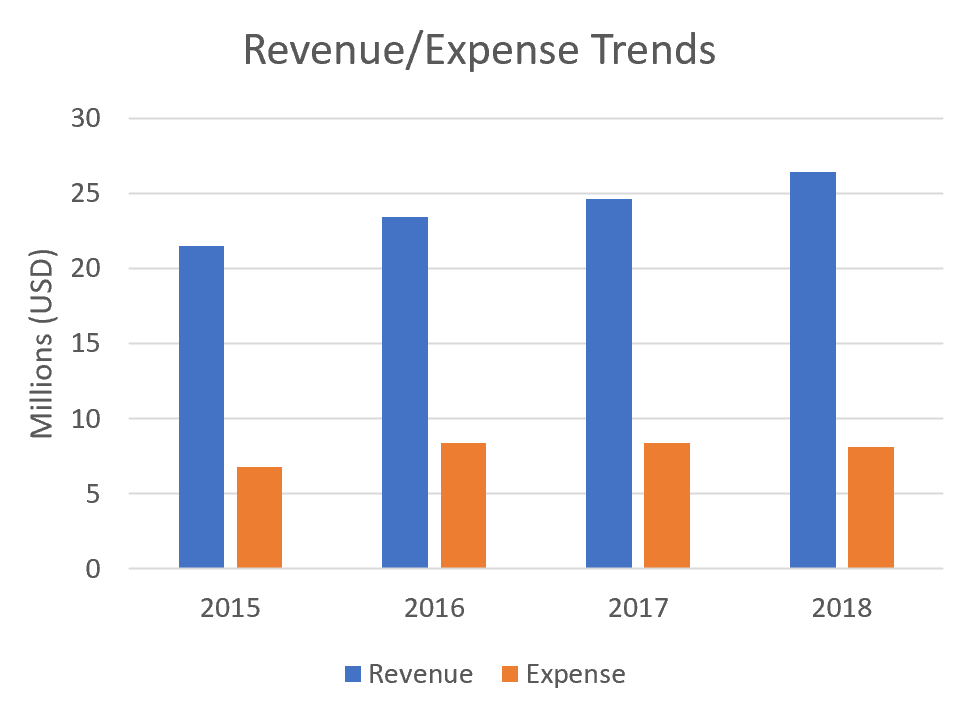
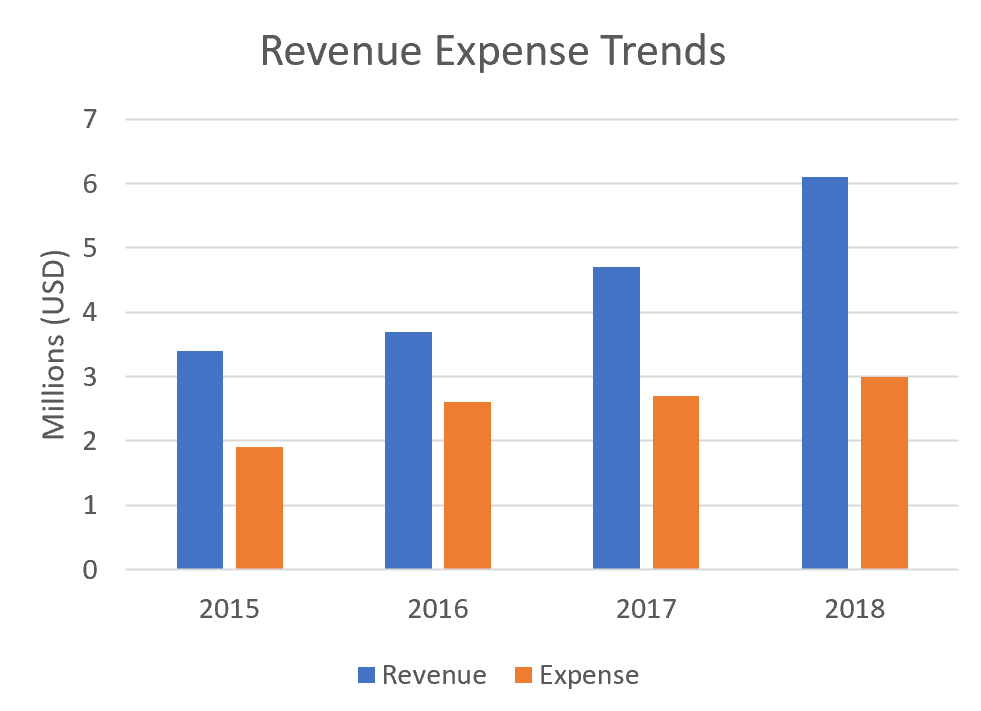
Expense Growth:
11.3%
Revenue Growth:
7.8%
Liabilities to Assets:
10.5%
Income Statement Summary
(FYE 09/2018)
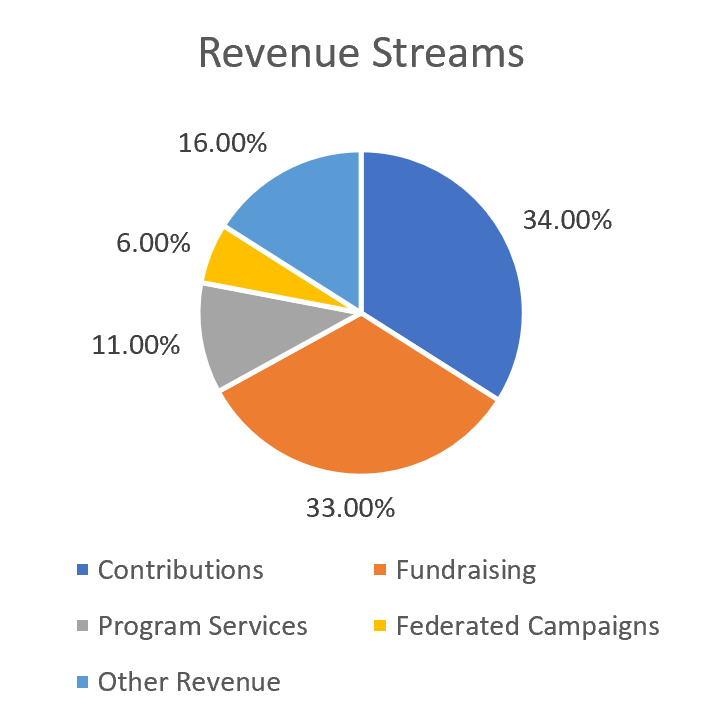
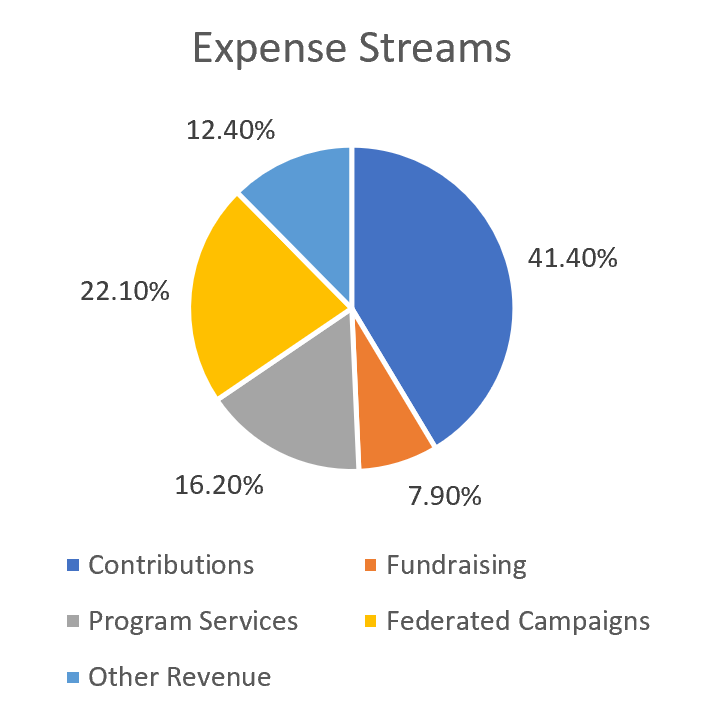
REVENUE
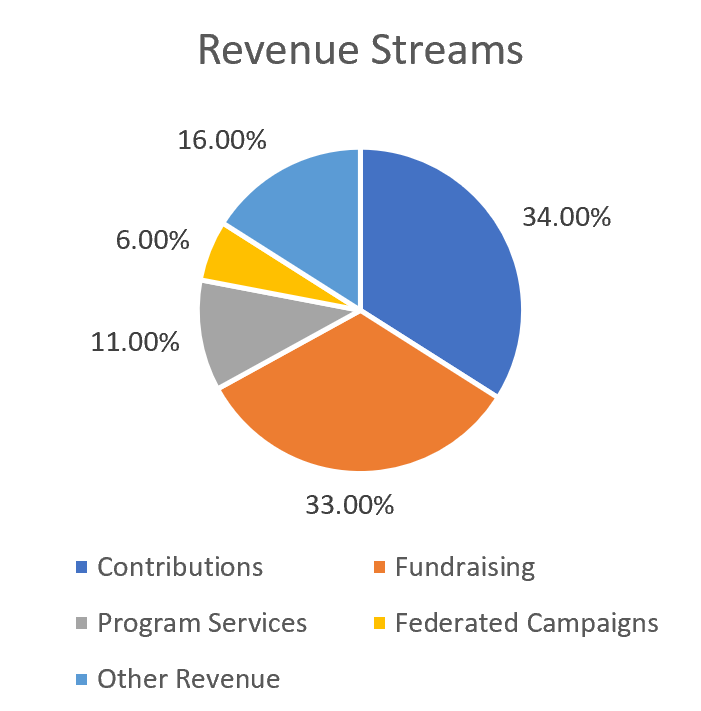
Contributions
Contributions, Gifts & Grants
$3,662,820
Federated Campaigns
$6,570
Membership Dues
$0
Fundraising Events
$0
Related Organizations
$3,913,550
Government Grants
$0
$7,582,940
$37,055
$7,619,995
$5,968,758
$13,588,753
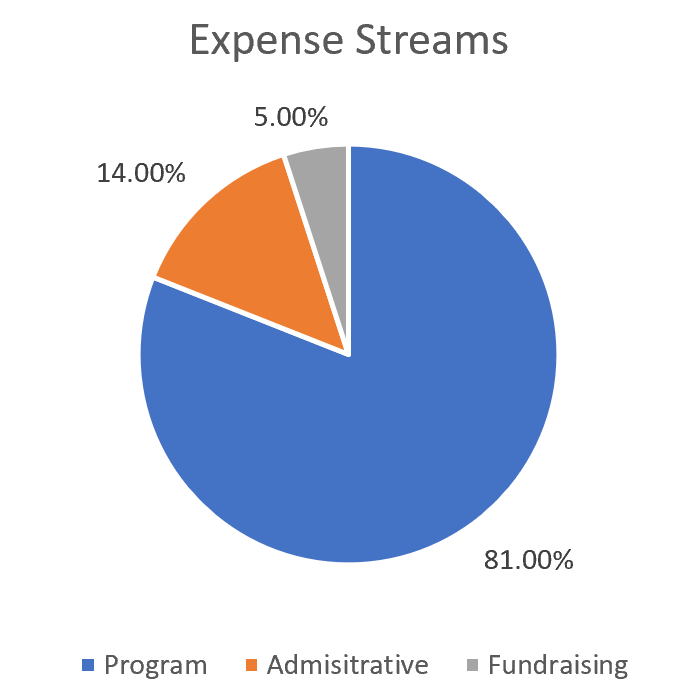
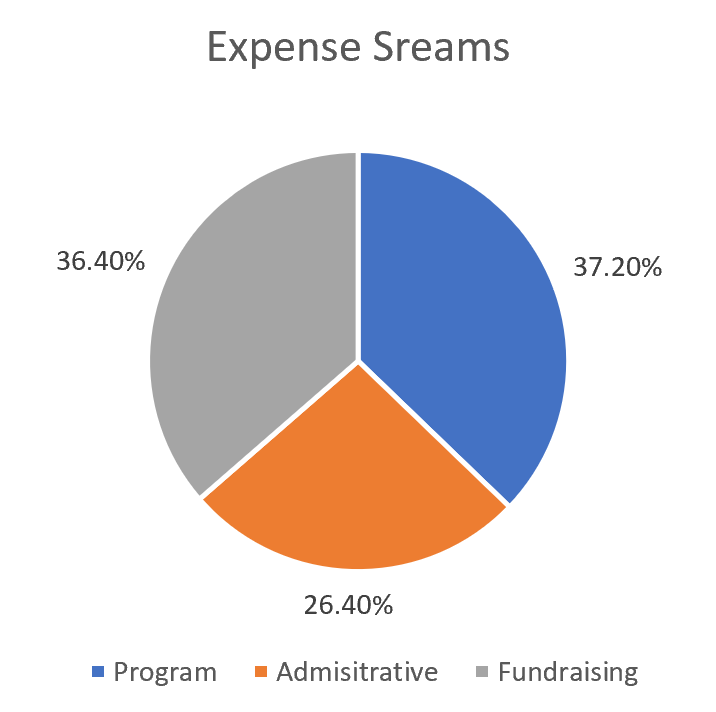
EXPENSES
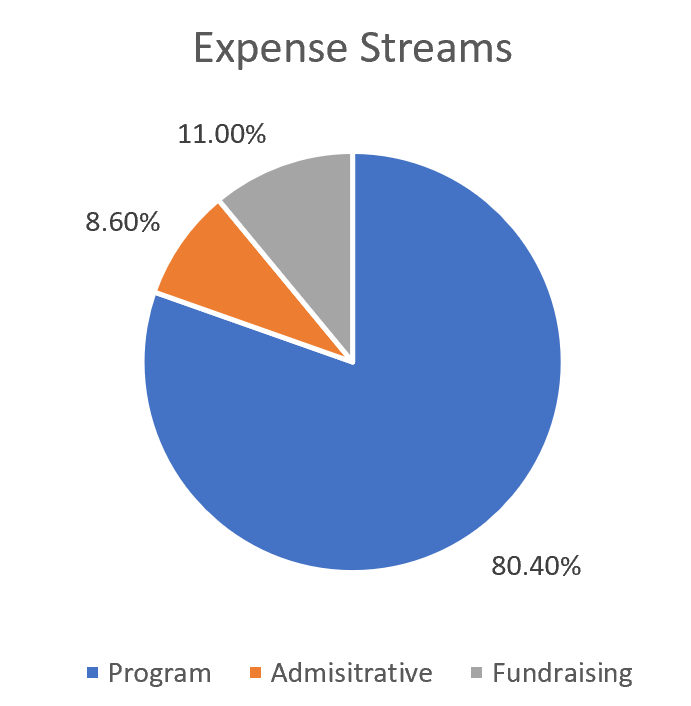
Program Expenses
$9,390,848
Administrative Expenses
$1,692,124
Fundraising Expenses
$747,499
$11,830,471
$0
$1,758,282
$99,416,921
Administrative Compensation
(FYE 09/2018)
$154,500
1.30%
Rick Singer
President, CEO
$443,800
$231,780
1.95%
Jin Thatcher
VP Operations & Administration
0
$217,400
1.83%
Katherine Bihr
VP Programs & Education
0
$186,800
1.57%
Michelle S. Kim
VP Strategic Partnerships
0
Other Salaries of Note
Financial Figures
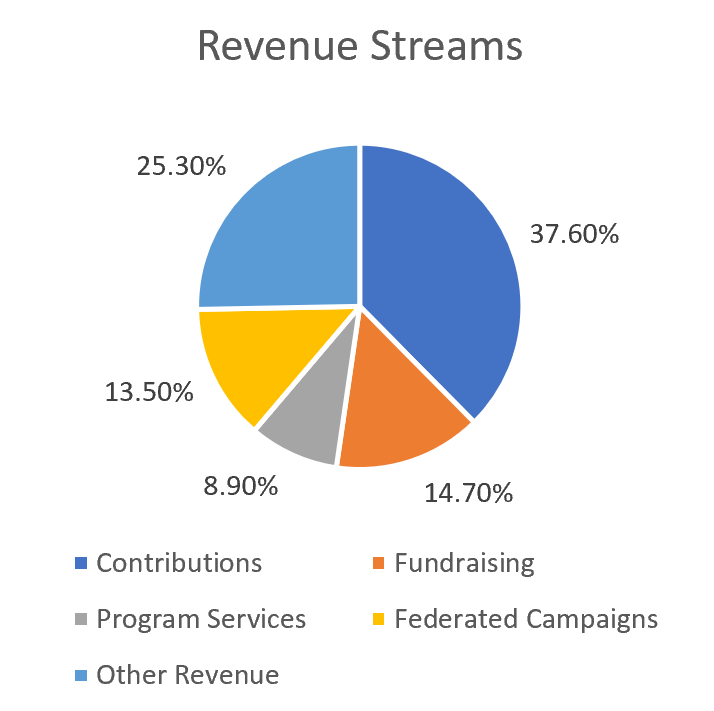
Revenue Streams
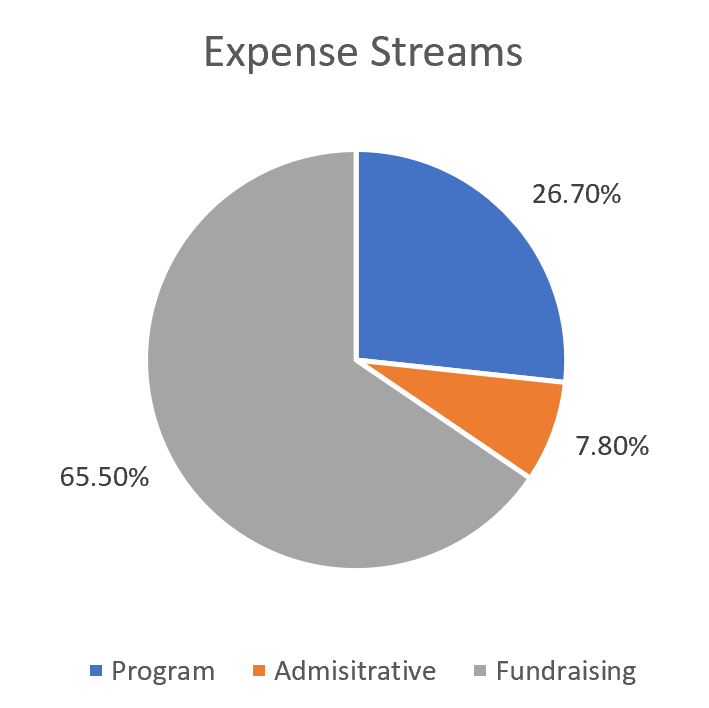
Expense Streams
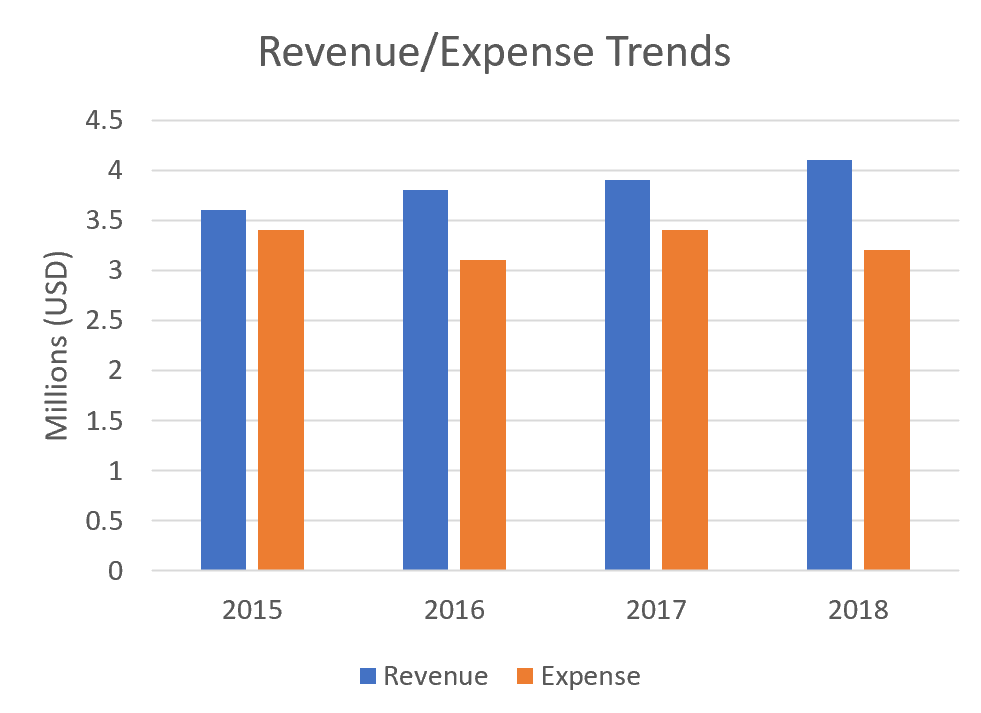
Revenue/Expense Trends
Contact Information
TGR Foundation, A Tiger Woods Charity
121 Innovation Drive
Suite 150
Irvine, CA 92617
tel: (949) 725-3003
EIN: 20-0677815
Financial Report
Fisher House Foundation
North America
$66,795,234
$84,86,486.00
72.00%
11.22 Years
Mission
Use Placeholder Paragraph
Financial Summary
Program Expenses:
$45.2% ($31,256,764)
Total Expenses:
81.2% ($54,943,648)
Fundraising Efficiency:
.28
Working Capital:
11.22 Years
Expense Growth:
14.6%
Revenue Growth:
9.1%
Liabilities to Assets:
11.9%
Income Statement Summary
(FYE 09/2018)
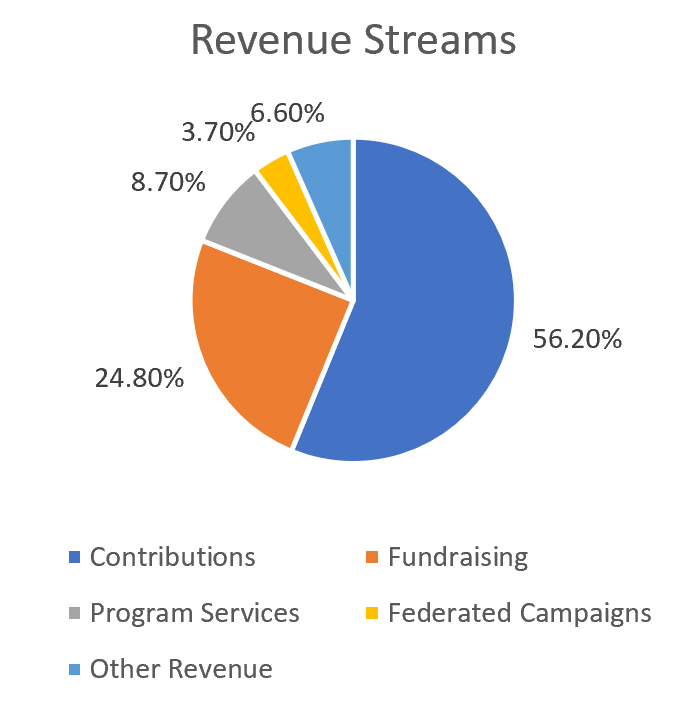
REVENUE
Contributions
Contributions, Gifts & Grants
$41,234,786
Federated Campaigns
$14,468,132
Membership Dues
$0
Fundraising Events
%1,864,416
Related Organizations
$9,468,136
Government Grants
$3,483,457
$56,486,213
1864886
9486321
12464789
26456896
EXPENSES
Program Expenses
11746182
Administrative Expenses
4561946
Fundraising Expenses
1789465
8486486
464153
3467649
121236846
Administrative Compensation
(FYE 09/2018)
245846
68%
Todd Barring
President, CEO
'$687,941
$212,465
.56%
Stacy Jones
Senior Vice President
'$48,643
'$164,649
.53%
Michael Bacher
VP Operations
12,846
184434
.47%
Jaqueline Lang
VP Finance
0
Other Salaries of Note
Financial Figures
Revenue Streams
Expense Streams
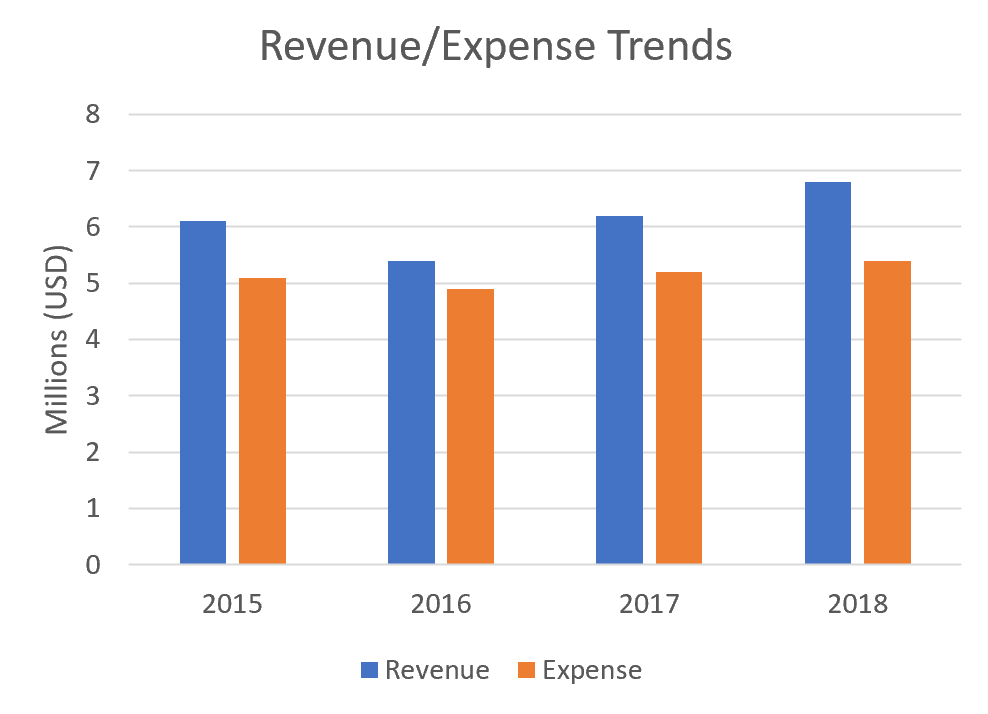
Revenue/Expense Trends
Contact Information
Andy Roddick Foundation
8509 FM 969
Building 509
Austin, TX 78724
tel: (512) 298-1960
EIN: 20-0014500
Financial Report
Andy Roddick Foundation
North America
$4,765,844
$39,76,471.00
83.00%
6.85 Years
Mission
Use Placeholder Paragraph
Financial Summary
Program Expenses:
$22.8% ($883,423)
Total Expenses:
71.8% ($2,176,431)
Fundraising Efficiency:
.17
Working Capital:
6.85 Years
Expense Growth:
12.5%
Revenue Growth:
11.4%
Liabilities to Assets:
8.1%
Income Statement Summary
(FYE 09/2018)
REVENUE
Contributions
Contributions, Gifts & Grants
1662820
Federated Campaigns
857064
Membership Dues
0
Fundraising Events
12346
Related Organizations
1213550
Government Grants
$0
1156940
31764
2947995
3184965
1466483
EXPENSES
Program Expenses
3390786
Administrative Expenses
992864
Fundraising Expenses
843657
6976471
26486
1758282
12416921
Administrative Compensation
(FYE 09/2018)
168550
1.28%
Michael Barnes
President, CEO
156448
142658
1.15%
James Marks
VP Operations
14655
88465
.86%
Erica Mathews
VP Marketing
5620
72955
.74%
Vincent Mallah
VP Domestic Programs
0
Other Salaries of Note
Financial Figures
Revenue Streams
Expense Streams
Revenue/Expense Trends
Contact Information
Andy Roddick Foundation
8509 FM 969
Building 509
Austin, TX 78724
tel: (512) 298-1960
EIN: 20-0014500
Financial Report
Georgia Transplant Foundation
North America
$7,346,123
$56,13,448.00
69.00%
7.8 Years
Mission
Use Placeholder Paragraph
Financial Summary
Program Expenses:
$33.7% ($3,346,464)
Total Expenses:
62.8% ($5,497,312)
Fundraising Efficiency:
.31
Working Capital:
7.8 Years
Expense Growth:
14.7%
Revenue Growth:
7.6%
Liabilities to Assets:
11.4%
Income Statement Summary
(FYE 09/2018)
REVENUE
Contributions
Contributions, Gifts & Grants
1264264
Federated Campaigns
764332
Membership Dues
0
Fundraising Events
1056466
Related Organizations
1213550
Government Grants
$0
1946731
846231
3468124
3134682
1564327
EXPENSES
Program Expenses
4846869
Administrative Expenses
842866
Fundraising Expenses
942655
5613448
345566
1112432
8134617
Administrative Compensation
(FYE 09/2018)
186447
1.33%
Eric Dach
President, CEO
122745
151864
1.21%
Tonya Johnson
VP Finance
49499
94765
1.01%
Matthew O'Donell
VP Global Affairs
0
816497
0.97
Martin Jensen
VP Operations
0
Other Salaries of Note
Financial Figures
Revenue Streams
Expense Streams
Revenue/Expense Trends
Contact Information
Georgia Transplant Foundation
2201 Macy Drive
Roswell, GA 30076
tel: (770) 457-3796
EIN: 58-207519
Financial Report
Lone Survivor Foundation
North America
$6,788,645
$31,65,336.00
77.00%
14.2 Years
Mission
Use Placeholder Paragraph
Financial Summary
Program Expenses:
$57.3% ($3,468,137)
Total Expenses:
62.8% ($5,613,614)
Fundraising Efficiency:
.23
Working Capital:
14.2 Years
Expense Growth:
13.9%
Revenue Growth:
9.7%
Liabilities to Assets:
6.4%
Income Statement Summary
(FYE 09/2018)
REVENUE
Contributions
Contributions, Gifts & Grants
126084
Federated Campaigns
234332
Membership Dues
0
Fundraising Events
1056466
Related Organizations
1643550
Government Grants
651344
1156940
286147
1364927
2346847
1746623
EXPENSES
Program Expenses
7648362
Administrative Expenses
1256645
Fundraising Expenses
1378895
3165336
46848
864621
7616485
Administrative Compensation
(FYE 09/2018)
205647
1.18%
Mark Mantrell
President, CEO
64721
142965
1.21%
Kenneth Windrow
Vice President
62475
128467
1.16%
Richard Deltoro
VP Veteran Affairs
0
121828
1.12
Patricia Atkins
VP Operations
0
Other Salaries of Note
Financial Figures
Revenue Streams
Expense Streams
Revenue/Expense Trends
Contact Information
Georgia Transplant Foundation
2201 Macy Drive
tel:
EIN:
Financial Report